Executive Summary
The Microsoft Foundry control plane acts as a unified platform for tracking, evaluating, and securing autonomous agents prior to shipping to production. While tool frameworks like the Foundry SDK define local system capabilities, the Foundry portal enforces strict structural testing across cost vectors, processing errors, and execution metrics.
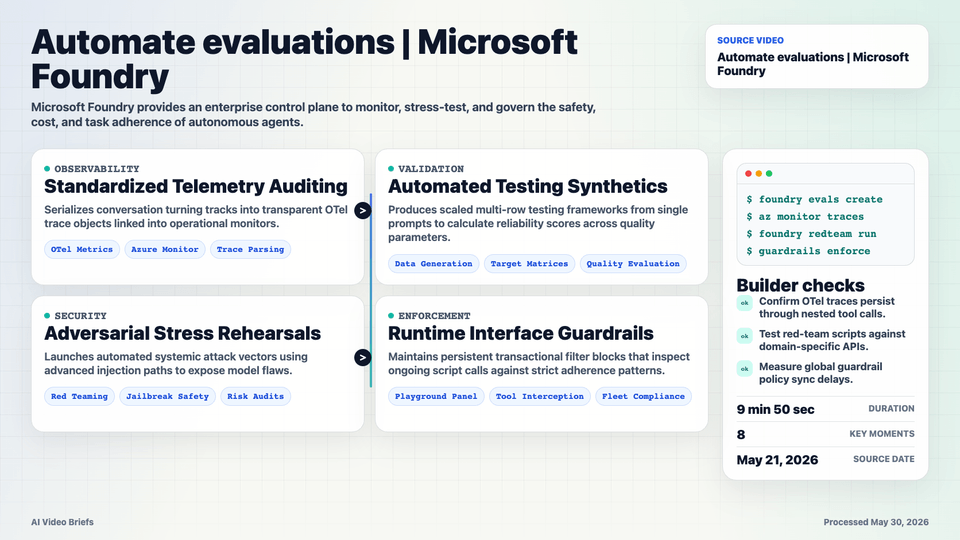
Foundry standardizes telemetry collection by processing conversational interactions into OpenTelemetry (OTel) system traces stored in Azure Monitor. Builders can analyze model behaviors, token loads, and nested tool requests without extracting log blobs. Automated evaluations allow users to create multi-row synthetic verification profiles or trigger adversarial red-teaming scripts that stress-test system prompts using jailbreaks like ASCII Smuggler and Base64 translations.
When processing loops highlight execution gaps—such as low task completion scores discovered through AI-driven diagnostic clustering—Foundry provides direct mitigation pathways via the agent playground. Users can deploy target-specific guardrails that monitor active runtime tool calls, forcing the backend model to maintain strict task adherence borders.
Key Takeaways
- Microsoft Foundry abstracts multi-agent lifecycle operations into a unified enterprise control interface.
- Conversational step histories map to standard OpenTelemetry trace graphs to isolate tool faults instantly.
- Synthetic data generators create extensive testing datasets directly from simple structural prompt patterns.
- Automated red teaming agents use multi-vector testing strategies to identify system injection holes early.
- AI-driven diagnostic cluster models parse failed validation runs to deliver automated code change suggestions.
- Task adherence guardrails inspect active tool execution payloads to intercept prohibited background steps.
Builder Implications
- Expose native OpenTelemetry tracking attributes within autonomous script loops to streamline diagnostic dashboard consumption.
- Incorporate automated synthetic document loops inside deployment systems to stress-test target pipelines without manual data entries.
- Integrate automated adversarial simulation engines into regression loops to verify prompt injection safety metrics.
- Leverage cluster classification processing to isolate systemic code execution flaws across distributed runner clusters.
- Enforce active middleware inspection checkpoints over database connectors to intercept rogue data mutations at runtime.
Things to Verify
- Verify trace tracking persistence when logging deep recursive tool calls across heterogeneous model structures.
- Qualify the behavioral variations of automated red teaming tests when evaluating highly custom domain-specific API scripts.
- Confirm policy sync delays when centrally deploying mitigation guardrails across global production agent fleets.